The 50/30/20 Budget Rule: Free Google Sheets Template
50/30/20 budget rule template for Google Sheets. Set up in under 10 minutes with free template included. Get the template.

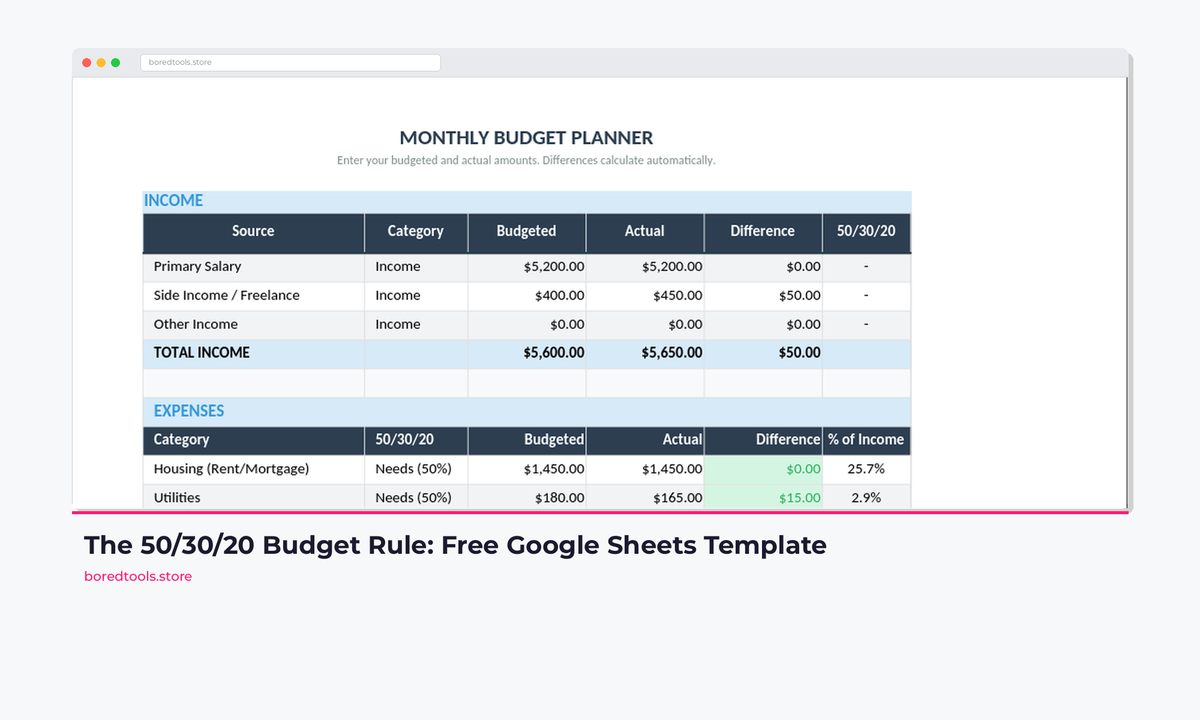
The 50/30/20 rule is the simplest budgeting method that actually works. Senator Elizabeth Warren popularized it in her book All Your Worth, and it's survived because it doesn't ask you to track every coffee purchase.
Here's the system: spend 50% of your after-tax income on needs, 30% on wants, and 20% on savings and debt repayment. No 47-category expense tracker. No guilt about buying lunch.
Below we'll show exactly how to set this up in Google Sheets. And if you want a ready-built version that also tracks debt payoff, net worth, and savings goals, grab the Budget Dashboard 2026.
Want it already built?
The Budget Dashboard 2026 includes 50/30/20 tracking plus debt payoff, net worth, and savings goal progress. One sheet. Everything connected.
Get the Budget Dashboard 2026 for $7.99 →How the 50/30/20 Rule Works
Take your monthly after-tax income (what actually hits your bank account) and split it into three buckets.
50%. Needs
Expenses you can't skip without real consequences:
- Rent or mortgage
- Utilities (electric, water, gas, internet)
- Groceries (actual groceries, not dining out)
- Health insurance and medical costs
- Minimum debt payments
- Transport to work (car payment, fuel, transit pass)
- Childcare
Example: If you take home £3,200/month, your needs budget is £1,600.
30%. Wants
Everything you enjoy but could survive without:
- Dining out and takeaway
- Streaming subscriptions (Netflix, Spotify, etc.)
- Gym membership
- Shopping (clothes, electronics, hobbies)
- Holidays and travel
- Upgraded phone plan
Example: On £3,200/month, your wants budget is £960.
20%. Savings and Debt Repayment
Money that builds your future:
- Emergency fund contributions
- Extra debt payments (above minimums)
- Retirement contributions
- Investing
- Saving for specific goals (house deposit, car, etc.)
Example: On £3,200/month, your savings target is £640.
If you're running this manually in a spreadsheet and want the summary dashboard, percentage bars, and variance tracking already wired up, the Budget Dashboard 2026 has it all built in.
When the 50/30/20 Split Doesn't Work
If you live in London, Sydney, or San Francisco, rent alone might eat 50% of your income. The rule isn't sacred. Here are the common adjustments:
- High cost-of-living areas: Try 60/20/20 or even 70/20/10 until you raise income or cut housing costs.
- Aggressive debt payoff: Flip to 50/20/30 (30% to debt and savings) until you're debt-free.
- High earners (£6,000+ take-home): You probably don't need 30% for wants. Move that extra to investments.
- Irregular income (freelancers): Use your average monthly income from the last 6 months as your baseline.
The ratios are guardrails, not handcuffs. If 50/30/20 doesn't fit, bend it. The goal is intentional spending, not perfect percentages.
Prefer a zero-based approach where every pound gets assigned a job? The zero-based budget template is worth a look alongside this one.
Building a 50/30/20 Budget in Google Sheets
Here's how to build this from scratch. Takes about 10 minutes.
Step 1: Create the Income Section
Open a new Google Sheet and set up your income at the top.

Your income goes in one cell. The 50/30/20 splits calculate automatically below it.
In cell A1, type Monthly After-Tax Income. In B1, enter your actual take-home pay. If you get paid biweekly, multiply one paycheck by 26 and divide by 12.
Below that, add the automatic budget splits:
| A | B | C | |
|---|---|---|---|
| 3 | Category | Percentage | Budget |
| 4 | Needs | 50% | =B1*B4 |
| 5 | Wants | 30% | =B1*B5 |
| 6 | Savings & Debt | 20% | =B1*B6 |
The formulas in column C calculate your budget for each bucket. Change your income in B1 and everything updates instantly.
Step 2: Build the Expense Tracker
Starting in row 8, create your expense log:
| A | B | C | D | |
|---|---|---|---|---|
| 8 | Date | Description | Amount | Category |
| 9 | 2026-03-01 | Rent | 1100 | Need |
| 10 | 2026-03-01 | Electric bill | 85 | Need |
| 11 | 2026-03-02 | Grocery run | 67.40 | Need |
| 12 | 2026-03-03 | Netflix | 15.99 | Want |
For the Category column (D), use Data Validation to create a dropdown:
- Select column D (starting from D9 downward)
- Go to Data → Data validation
- Set criteria to "List of items"
- Enter:
Need, Want, Savings
This prevents typos and keeps the SUMIFS formulas in the next step working correctly.
Step 3: Add the Summary Dashboard
Create a summary section that shows how you're tracking against each bucket. Put this to the right of your expense log or on a separate tab.
Needs Summary (cell F3):
=SUMIFS(C9:C500, D9:D500, "Need")
Wants Summary (cell F4):
=SUMIFS(C9:C500, D9:D500, "Want")
Savings Summary (cell F5):
=SUMIFS(C9:C500, D9:D500, "Savings")
Remaining in each category:
=C4-F3   (Needs remaining)
=C5-F4   (Wants remaining)
=C6-F5   (Savings remaining)

The summary dashboard shows budget vs. actual for each category at a glance. Green means under budget, red means over.
Step 4: Add Conditional Formatting
Make overspending impossible to miss:
- Select the "Remaining" cells
- Go to Format → Conditional formatting
- Add a rule: "Less than 0" → red background
- Add a rule: "Greater than 0" → green background
Now you'll see at a glance if you've blown any category.
Step 5: Add a Simple Chart
Select your summary data (categories, budget, and spent amounts), then:
- Go to Insert → Chart
- Pick a bar chart or stacked bar chart
- You get an instant visual of budget vs. actual spending
Skip the build and get a full dashboard
The Budget Dashboard 2026 has the income section, expense tracker, summary dashboard, charts, and debt payoff all pre-built. Works for both UK and US finances. One-time download.
Grab it for $7.99 on Payhip →Tips for Making the 50/30/20 Budget Stick
Log expenses daily, not weekly. It takes 30 seconds with your morning coffee. Wait until Sunday and you'll forget half your transactions. Give up by week three. Every time.
Round up when categorising. Not sure if something is a need or a want? Call it a want. You'll never regret being conservative here.
Check in every Sunday. Five minutes on your summary dashboard. Are you on track? Do you need to cut dining out for the rest of the month? A weekly check prevents month-end surprises.
Give yourself permission to adjust. If 50/30/20 doesn't fit your life, try 60/20/20 or 50/25/25. The point is intentional spending, not perfect ratios.
Automate the 20%. Set up an automatic transfer to your savings on payday. If the money never sits in your current account, you won't miss it.
If you're paid irregularly or want to budget by paycheck rather than by month, the paycheck budget template handles that better than the monthly 50/30/20 setup.
Common Mistakes with the 50/30/20 Rule
Counting minimum debt payments as "Savings." Minimum payments are needs. They're required. Only extra payments above the minimum count toward your 20%.
Forgetting irregular expenses. Annual car insurance. Holiday gifts. MOT. These blow up your budget if you don't plan for them. Divide annual costs by 12 and treat them as monthly needs.
Being too granular. The point of 50/30/20 is simplicity. If you're arguing with yourself over whether a gym membership is a need or a want, you're overthinking it. Pick one and move on.
Using gross income instead of net. The rule runs on after-tax income. Use your gross salary and you'll overspend every single month, because your "50%" is actually 65% of what you take home.
Download the Free Template
We put together a ready-made 50/30/20 Google Sheets template with everything above already built in. Income section, expense tracker with dropdown categories, summary dashboard, and charts.
No email signup. Just copy it to your Google Drive and go.
Download the free 50/30/20 budget template on Payhip → | Also on Payhip
Need more? Debt payoff tracking, net worth monitoring, savings goal progress, and a proper dashboard. Check out the Budget Dashboard 2026 on Payhip →. It covers the 50/30/20 method plus everything else you'd eventually build yourself.
UK edition built for British finances. HMRC Self Assessment categories, council tax tracking, National Insurance (Class 2 and Class 4) calculations, ISA allowances, and GBP formatting throughout. US edition included with IRS tax brackets, 401(k) tracking, and USD formatting.
Related Reads
- Best Budget Spreadsheet Templates in 2026
- How to Track Your Net Worth in Google Sheets
- Budget Template for Couples: How to Manage Money Together
- Debt Payoff Calculator: Snowball vs Avalanche Method
Wrapping Up
The 50/30/20 rule works because it kills decision fatigue. Three categories. One clear target for each. You don't debate whether a haircut belongs under "personal care" or "grooming." It's a need, it goes in the 50%, done.
Build the spreadsheet, log your expenses for one month, and see where your money actually goes. Most people are surprised. That surprise is the first step toward actually controlling it.
Ready to take it further?
The Budget Dashboard 2026 includes 50/30/20 tracking, debt payoff planner, net worth monitor, and savings goal progress. UK and US editions. $7.99, one-time.
Get the Budget Dashboard 2026 →Get free spreadsheet templates and updates. New templates, feature updates, and practical guides delivered to your inbox. No spam, unsubscribe anytime.
Subscribe free → | Already have a template? Download the free budget tracker or free meal planner. No email required.
Choose the right next step
Need a simple budget tracker spreadsheet? Start with the Free Budget Tracker. Use Budget Dashboard 2026 when you want budgets, debt, savings and net worth in one workbook. Choose the Complete Collection when several parts of life admin need sorting.